Who Are The Poor Of India?
Ever since I quit the corporate world, the story I have been telling myself is that I want to work on uplifting the poorest.
I am data-man, or so I would like to think. So, it is essential for me to understand the size and depth of this problem of poverty. And how do you even define poverty? Let alone quantify it?
Over the past three years, I believe I have earned a decent understanding of it. This is an attempt at formalizing that understanding.
First, what is poverty?
Believe it or not, this isn’t straightforward. There are four different ways to look at it:
- Absolute Poverty: This draws an income line across the world and everyone under it is poor and everyone above it is not poor. There are different lines, the most popular being the “extreme poverty” line which is $1.90 / day adjusted for purchasing power parity. Which basically means let’s keep things apples to apples, not apples to moons. Pros and cons here and you can think about that all day.
- Relative Poverty: This arranges people within a certain population according to income, and those that fall in the bottom tranche are considered poor. A good way of understanding this is that while there is no absolute extreme poverty in the U.S., there’s a ton of relative poverty. Relative poverty will almost always exist. Absolute poverty doesn’t need to.
- Multidimensional Poverty: This is my preferred definition. It is based on the tenet that poverty is more than just a lack of money — it is a lack of access to healthcare, education and a decent standard of living. It just falls short of including dignity, but dignity is something even the Gods won’t be able to quantify. Intuitively, this increases the total number of poor because it increases that basic standard we aspire to for humanity.
- Hunger: If you’re absolutely poor, you’re probably hungry. So, sometimes, looking at the hunger index is also a good way of gauging pain. Sounds morbid, but it is easier to quantify.
And these definitions are just skimming the surface of the ocean that is measuring injustice. There are also recall methods, survey nuances, time-sensitivity issues, and other permutations that give data-abusers enough ammo to craft any story that fits their narrative.
I’m going to avoid doing that.
Okay enough jargon, so how many people in India are poor then?
You guessed right; there are many different estimates for this as well. But I promise I’ll end this section with somewhat of a reasonable number for us to anchor to.
Meanwhile, here is a bunch of poverty estimates for India that you’ll see flying around in the public:
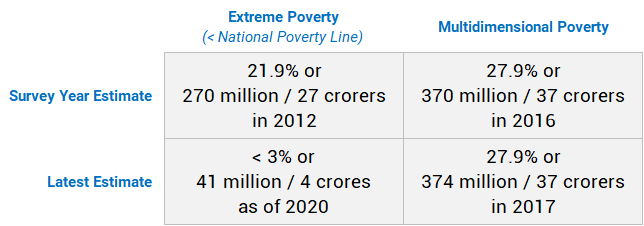
Image by Author, Sources: 2012 Extreme Poverty, 2020 Extreme Poverty, Multidimensional Poverty
It’s important to consider what the numbers were during the survey year because that’s when data is (or should be) the cleanest. Estimates based off that add more assumptions to an assumption-laden world, which only contaminates the truth.
For instance, I don’t fully believe World Poverty Clock’s assumption that India has only 40 million extremely poor people right now. Either way, I don’t think looking at extreme poverty is the best way of looking at specific country’s poverty — it’s singular, and poverty is not singular. So, let’s drop that and progress.
Multidimensional poverty on the other hand, is hands-down the best way to look at poverty based on what’s out there. It was developed by Oxford University in 2010 so there’s some credibility for you. This metric is hard to calculate but not impossible. Enter UNDP. They have been nice enough to calculate and aggregate this for us.
Ahh, I’m finally getting to the point.
In India, in 2017, 28% or 374 million were multidimensionally poor. I did my own math from an incredible human development dataset from 2012 using a similar thought process, and my estimate was ~34% for back then. So, taking all that into consideration, and the fact that India has been growing economically (at least pre-COVID), I think it is fair to assume that today, India has a multidimensional poverty rate of 20%-25%. Extrapolating that to current population estimates (2020), that’s somewhere between 274 million and 342 million people.
To make it a little easier, let’s settle for a number somewhere in the middle which conveniently comes to 300 million people that makes up ~22% of India’s population.
There, as I promised, a reasonable number we can anchor ourselves to.
Fine, so who are the poor?
It’s now time to get to the meat of things. If you’re familiar with the social impact space, none of the above should have been bombastically revealing. The following though? Maybe.
The question that was grappling my mind (and my heart) is who exactly are the poor? And not just from a meta, philosophical perspective, but from an actionable, data-driven perspective.
Farmers, construction workers, waste-pickers, Dalits — that’s what comes to mind right off the bat, but how many of them? By how much? Who else? From what perspective are they poor — health, education, income? And what about security guards and dhobis and coolies? Are they poor? Not all of them, obviously, but how many?
So yes, if work is the center of sustenance of life, I was curious what type of workers fell under the landscape of the poor in India.
I happened upon an incredible human development survey from 2012 that had data at an individual and a household level for over 40,000 households and over 200,000 individuals. It was representative and has been used by many impact strongholds including the International Labour Organization as recently as 2018. Credibility.
I isolated the 50,000 individuals who were mostly working, cleaned up some of the occupation data, mapped it, calculated a reasonable version of multidimensional poverty based on the data that was available, and voila! Here is how I answered those grappling questions of the head (and the heart).
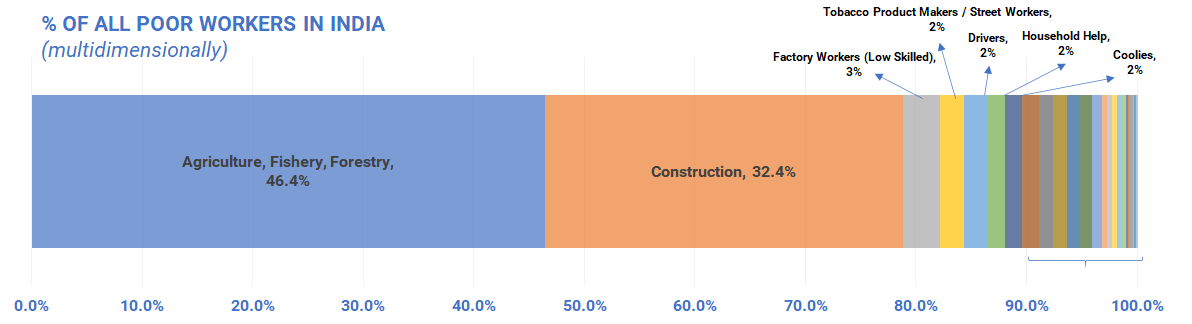
Image by Author, Based on 2012 India Human Development Survey (IHDS)No surprises here. ~79% of all poor workers in India (62 million) work either in agriculture or construction. Low skilled factory workers come third at 3%, which is substantially lower. The rest are 2% or less. The small revelation for me was the tobacco product makers (beedi-makers) at 2.2% or almost 2 million. They earn the lowest on average and almost a third of all of them are multidimensionally poor. Interesting cognitive dissonance here: tobacco is bad for you but what happens to the millions of people who make a (poor) living out of making tobacco products?
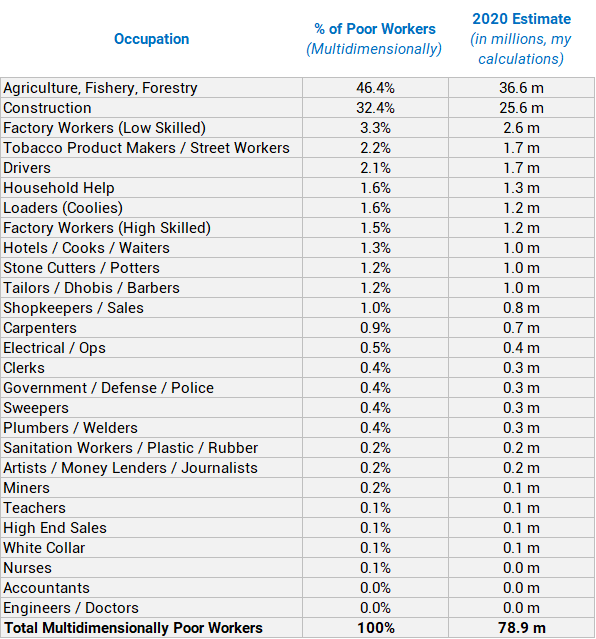
Image by Author, Based on 2012 India Human Development Survey (IHDS)We now know that most of the poor are farmers and construction workers. But they also constitute the largest proportion of all workers in general. So what percentage of farmers, and construction workers and drivers are poor?
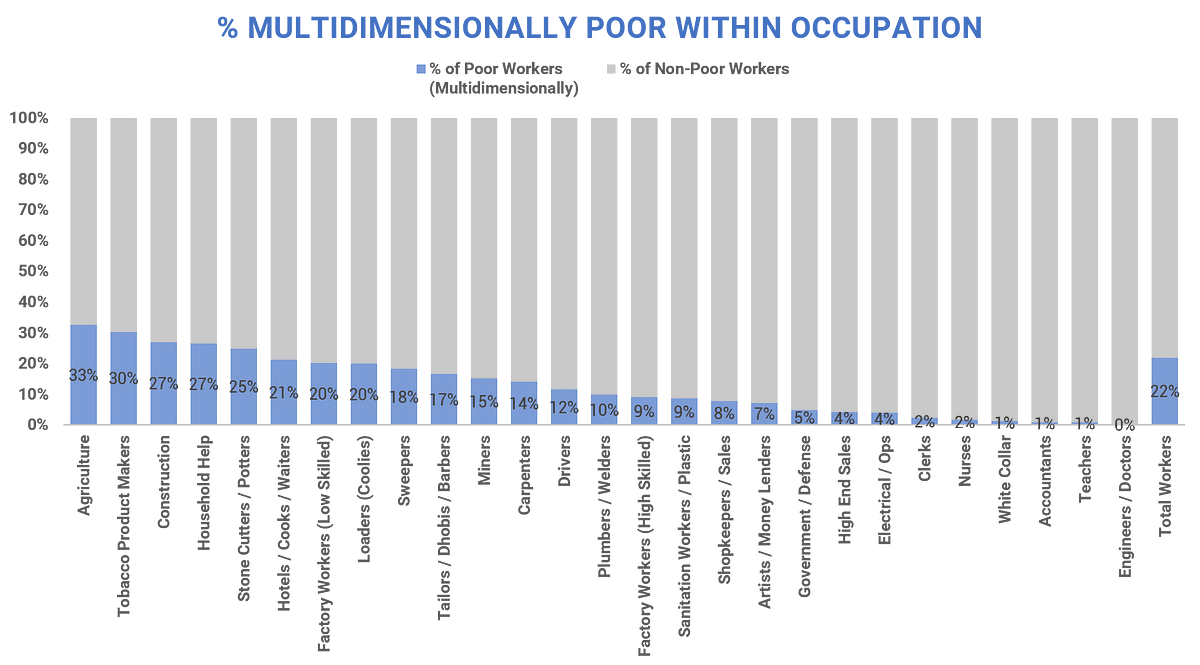
Image by Author, Based on 2012 India Human Development Survey (IHDS) and my calculationsAlmost a third of all agricultural workers are poor. Construction workers are also above the average, and so are tobacco product makers, household help and stone cutters. And remember, these folks are not just poor from an economic perspective, they are also less educated and much more at risk with their health.
Modified HDI
Inspired by UNDP’s Human Development Index (HDI), I created a morphed / modified version of it for the various types of workers of India. Why morphed? Well because I was limited by the information available by worker in the data set I was using. Enough excuses, enough disclaimers, it is still helpful, albeit not telling us anything spectacularly new.
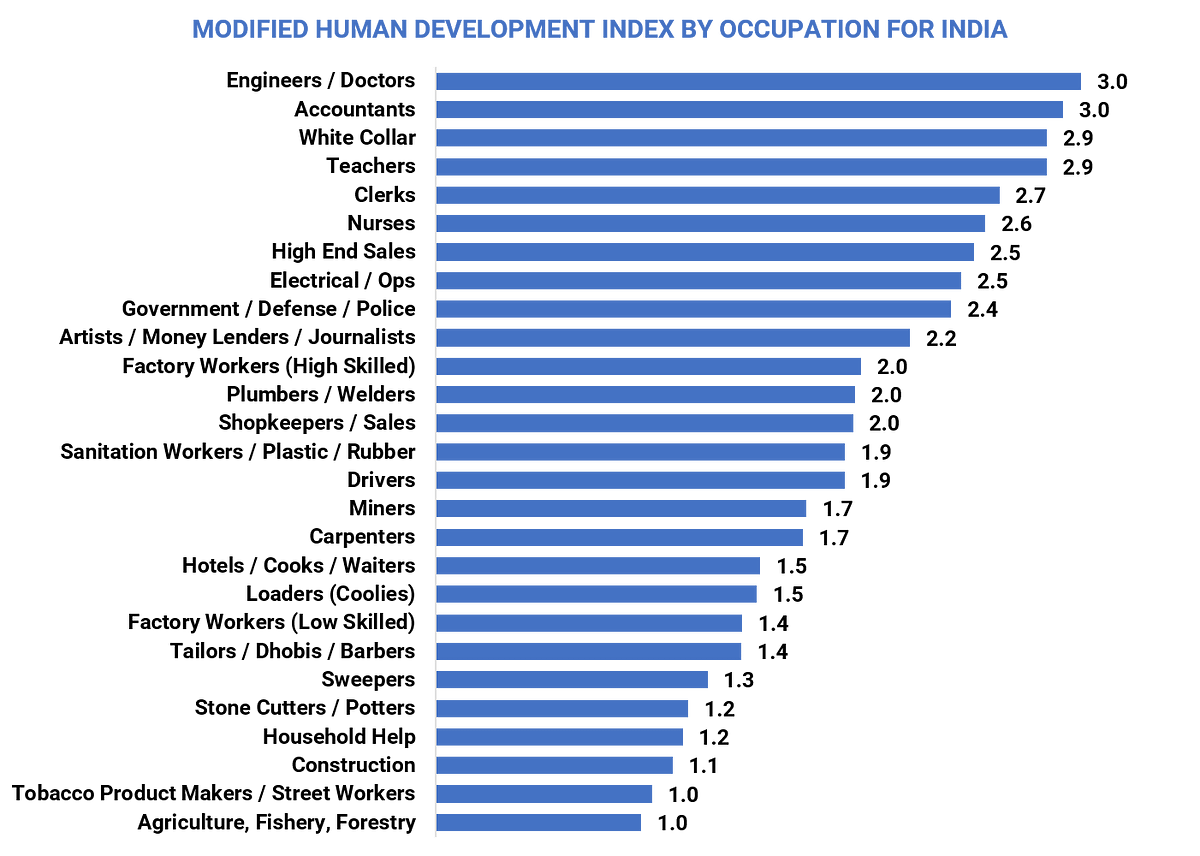
Similar story — farmers, tobacco makers, construction workers, maids and stone cutters live a disdainful life.
One of the morphs I sizzled into this modified HDI was the inclusion of a social status index. This is a tad bit controversial and it’s pretty sad that I even have to include something like this, but in India, it’s just not advantageous being born into a lower caste or a marginalized minority. Adding that dimension into the mix pulls the occupation group of sweepers lower down. Most sweepers and sanitation workers (~60%) are dalits (low caste folks). Most stone cutters are also dalits and many are adivasis (protected tribes). This shouldn’t make a difference, but it does, and not for the right reasons.
Anything else?
Look, this is still far from perfect. Just because many farmers and constructions workers are poor, doesn’t mean that they are the poorest. Just because some people have money and healthcare and education, doesn’t mean they live happy and wholesome lives. Quantifying dignity, happiness, pain and injustice are hard if not impossible.
But that doesn’t mean we can’t try. And that is not an excuse to not do anything about it.
So now what?
Let’s get at it. As effectively and quickly as we can, while still ensuring we seek systemic solutions that solve this problem for the long run. I don’t think we need a quick fix per se, I think we need long-term fix sooner rather than later. We have made enough progress today to envision a world where multidimensional poverty does not exist.
I essentially did this analysis for myself. I will start a social enterprise focusing on this very issue, and wanted to understand it better. And despite breaking the problem down, I am still battling through other dimensions that are hard to reconcile.
If you have any epiphanies, please decorate me with them.
A note on the sources for this post:
The base for the majority of this analysis is the micro-data of the India Human Development Survey: Desai, Sonalde, Reeve Vanneman and National Council of Applied Economic Research, New Delhi. India Human Development Survey-II (IHDS-II), 2011–12. ICPSR36151-v2. Ann Arbor, MI: Inter-university Consortium for Political and Social Research [distributor], 2015–07–31. http://doi.org/10.3886/ICPSR36151.v2
I created and cleaned some of the data to make it more sensible.
I have cited sources for all one-off data where I have used them.
Any questions / concerns, please do not hesitate to reach out. Am a believer in full transparency.